Feedstock traceability & dosing
Link what goes in to what comes out.
- Weighbridge and batch / supplier IDs
- Storage inventory and dosing flow
- Feedstock mix by digester and shift
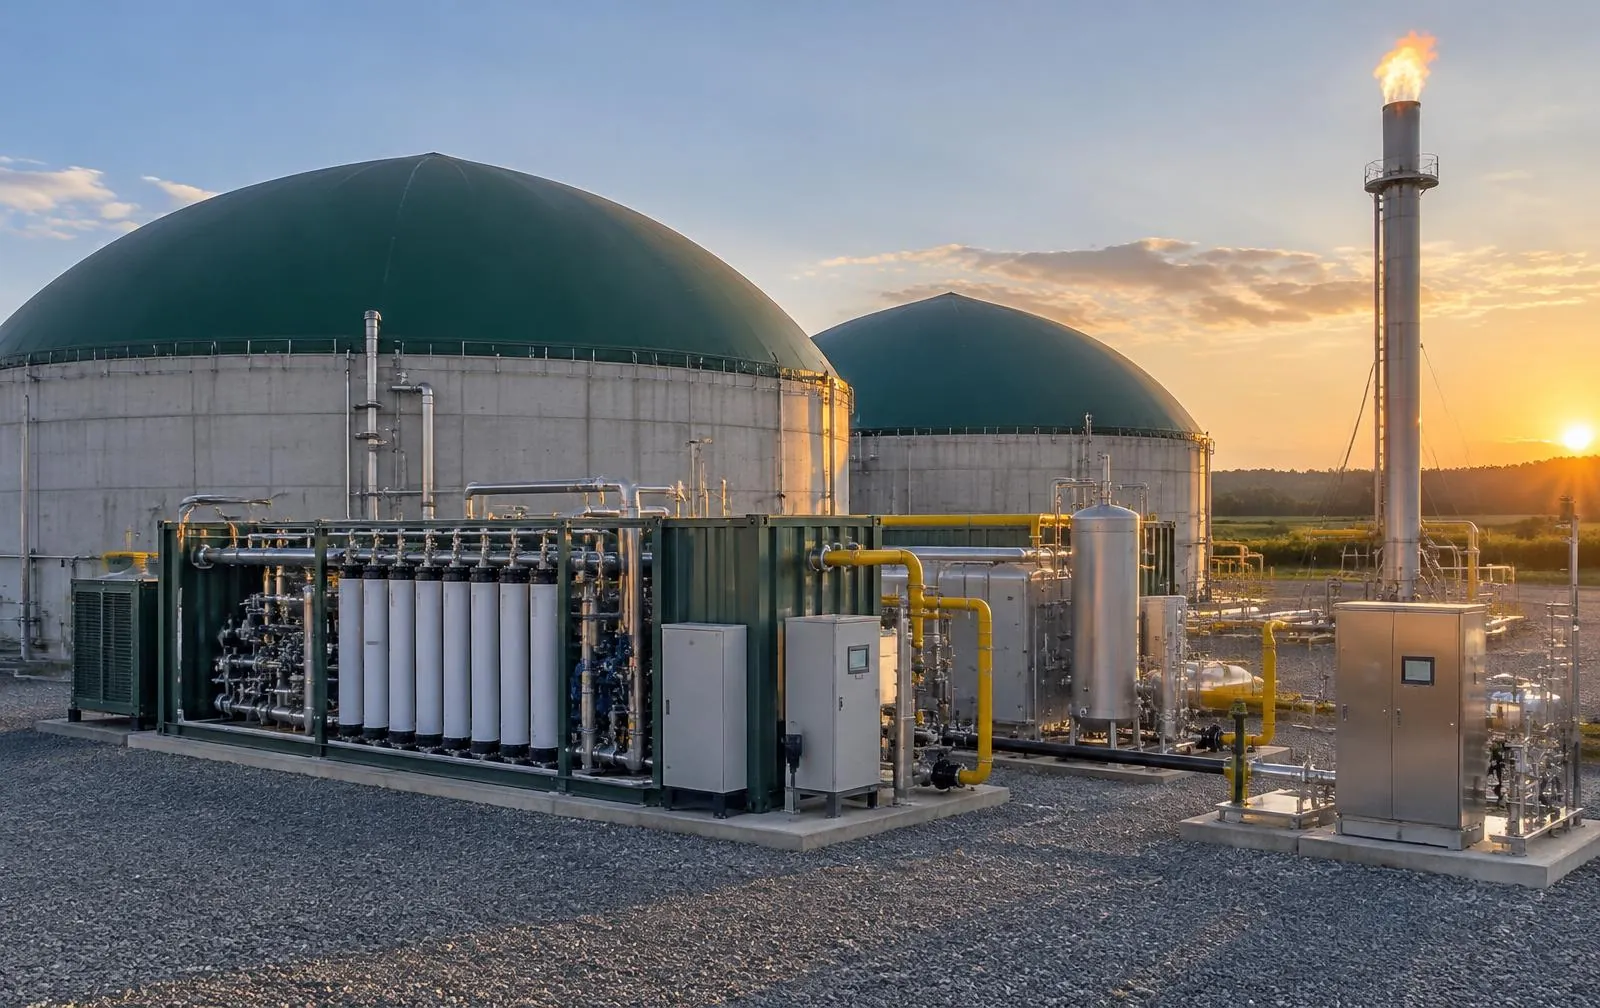
From feedstock to renewable gas—connected, safe and measurable operations.
TAS is the automation, instrumentation-integration and digital operations partner for biogas, CBG / Bio-CNG, RNG and CHP plants. We connect digesters, gas-upgrading skids, compressors, CHP engines and analyzers into one supervisory layer—PLC/SCADA, historian, alarms and KPI dashboards—so owners, process OEMs and EPCs can run every site with reliable, auditable data.
Feedstock, digesters, gas, CBG and CHP on a single timeline.
Trend-based alerts on temperature, gas quality and equipment health.
Meter-to-report traceability for production and dispatch.
Integrates OEM skid PLCs, analyzers and meters across protocols.
Validated, time-stamped records for sustainability reporting.
Most biogas sites run several islands of automation—a digester PLC, an upgrading-skid PLC, a compressor panel, a CHP controller and standalone analyzers. TAS connects them, contextualises the data by asset and process stage, and turns it into one dependable operating picture.
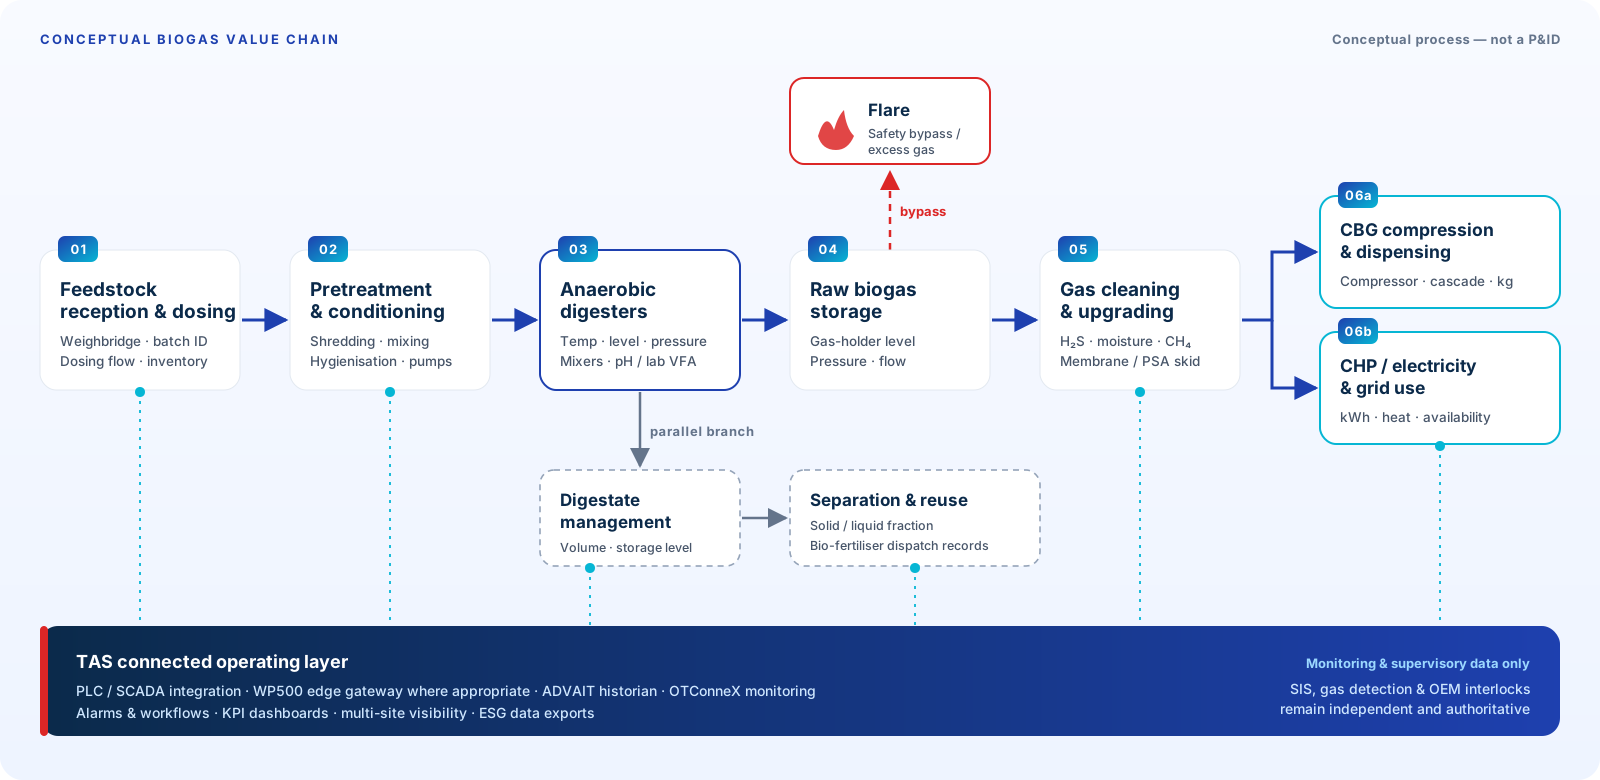
Weighbridge tickets, supplier and batch IDs, storage and dosing flow.
Shredding, mixing, hygienisation / heating; pump and motor status.
Temperature, level, pressure, mixers, heating loops; pH and lab VFA/TAC.
Gas-holder level and pressure, raw-gas flow and composition.
Desulphurisation, drying, membrane / PSA skid status and product-gas quality.
Compression, cascade and dispensing in kg—or CHP kWh, heat and availability.
Biogas plants are living processes connected to mechanical, electrical and gas systems from many vendors. Without connected data, problems surface late—as lower gas yield, unplanned downtime or reports that don’t reconcile.
Seasonal and supplier variation shifts organic loading and gas potential.
Temperature drift, foaming or acidification signals are spotted too late.
Yield per tonne is hard to track without trusted input and output data.
H₂S, moisture and CH₄ swings stress upgrading, engines and compressors.
Engine trips and derates reduce power export and heat recovery.
CBG output depends on compressor health, cascade pressure and dispensing.
Raw-gas, product-gas and dispatch meters rarely agree without normalisation.
Leak events, flaring and slip need consistent records, not estimates.
OEM panels, spreadsheets and logbooks with no single source of truth.
Monthly reports compiled manually from many sources, under time pressure.
TAS provides OT automation, PLC/SCADA engineering, industrial communication, ADVAIT historian and OTConneX monitoring, WP500 edge gateways where appropriate, analytics, alarm workflows and multi-site visibility. We work alongside your process licensor, OEMs and EPC—TAS does not design fermentation biology or act as the biogas process licensor or EPC.
Link what goes in to what comes out.
Stability signals in one trend view.
Volumes you can defend.
Composition tracked against limits.
OEM skids brought into one view.
Visibility only—never control.
Power and heat accounted for.
Every event, time-stamped and searchable.
Reports that build themselves.
OTConneX and WP500 edge connectivity (where appropriate) give engineers secure, read-only visibility of remote and multi-site plants, with run-hour and condition-based maintenance triggers pushed to your CMMS.
Balance-of-plant PLC programming, SCADA/HMI development and protocol integration (Modbus TCP/RTU, OPC UA, MQTT, industrial Ethernet) to the owner’s specification—coordinated with OEM skid control philosophies.
An example of the role-based cockpit TAS configures for plant managers and shift teams—production, gas quality, digester health, CBG and CHP output and active alarms on one screen, drilling down to equipment and trends.
Illustrative mock-up with sample values only—not data from, or a performance claim for, any TAS installation. Actual screens, KPIs and calculations are configured per project.
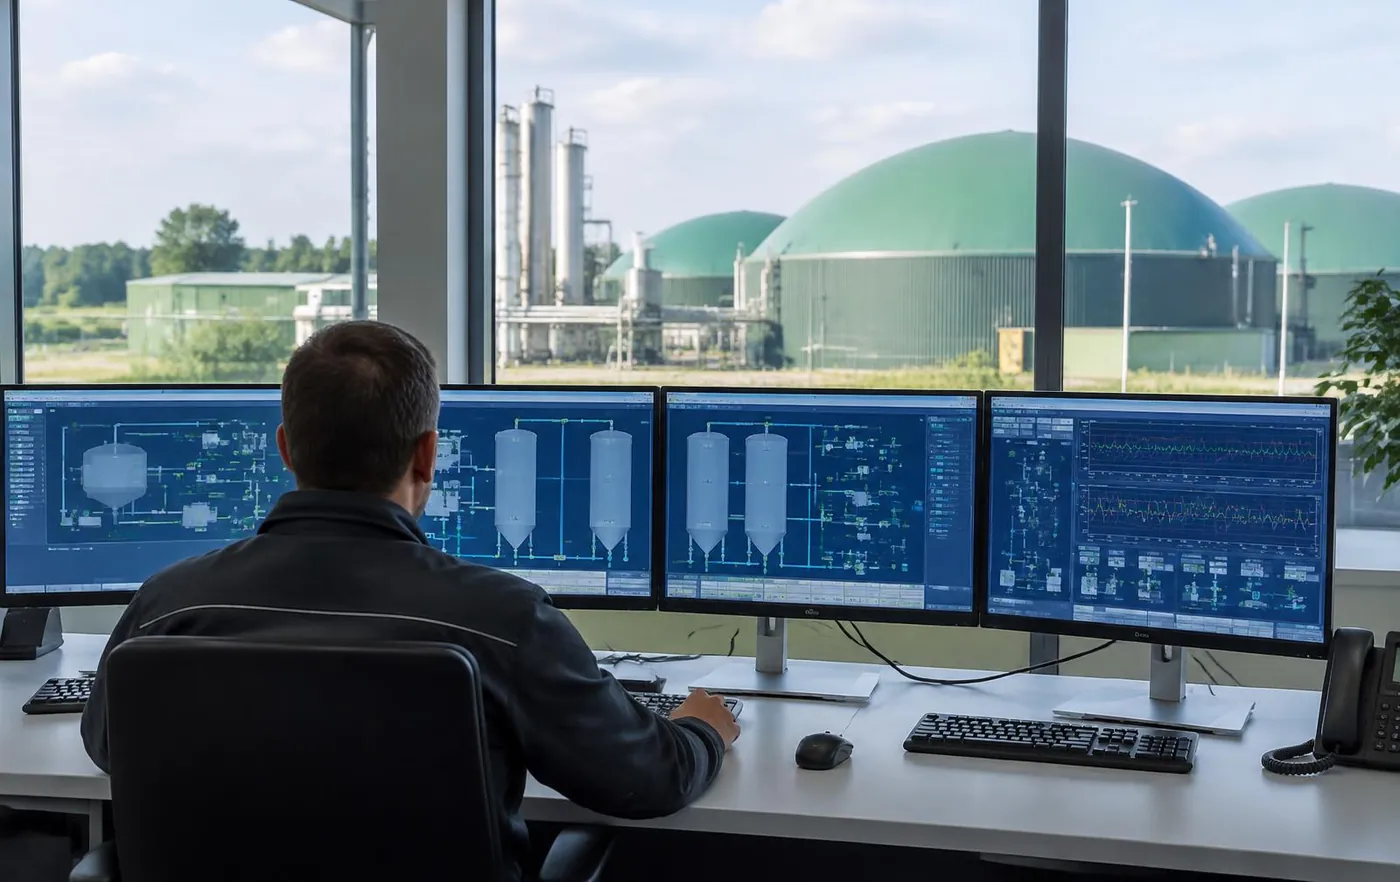
Feedstock, regulation and end-use differ by segment. TAS configures data models, KPIs and reports to match each operating context.
Source-segregated organics with variable composition and contamination.
Seasonal residues and process wastes, often co-located with the factory.
High-strength effluent treatment where biogas is a by-product of compliance.
Farm and cluster digesters with distributed sites and limited on-site staff.
Sludge digestion integrated with existing STP/WWTP SCADA and energy recovery.
Upgrading, compression, cascade storage and dispensing or grid injection.
Gas-engine power and heat for self-use or export, with availability tracking.
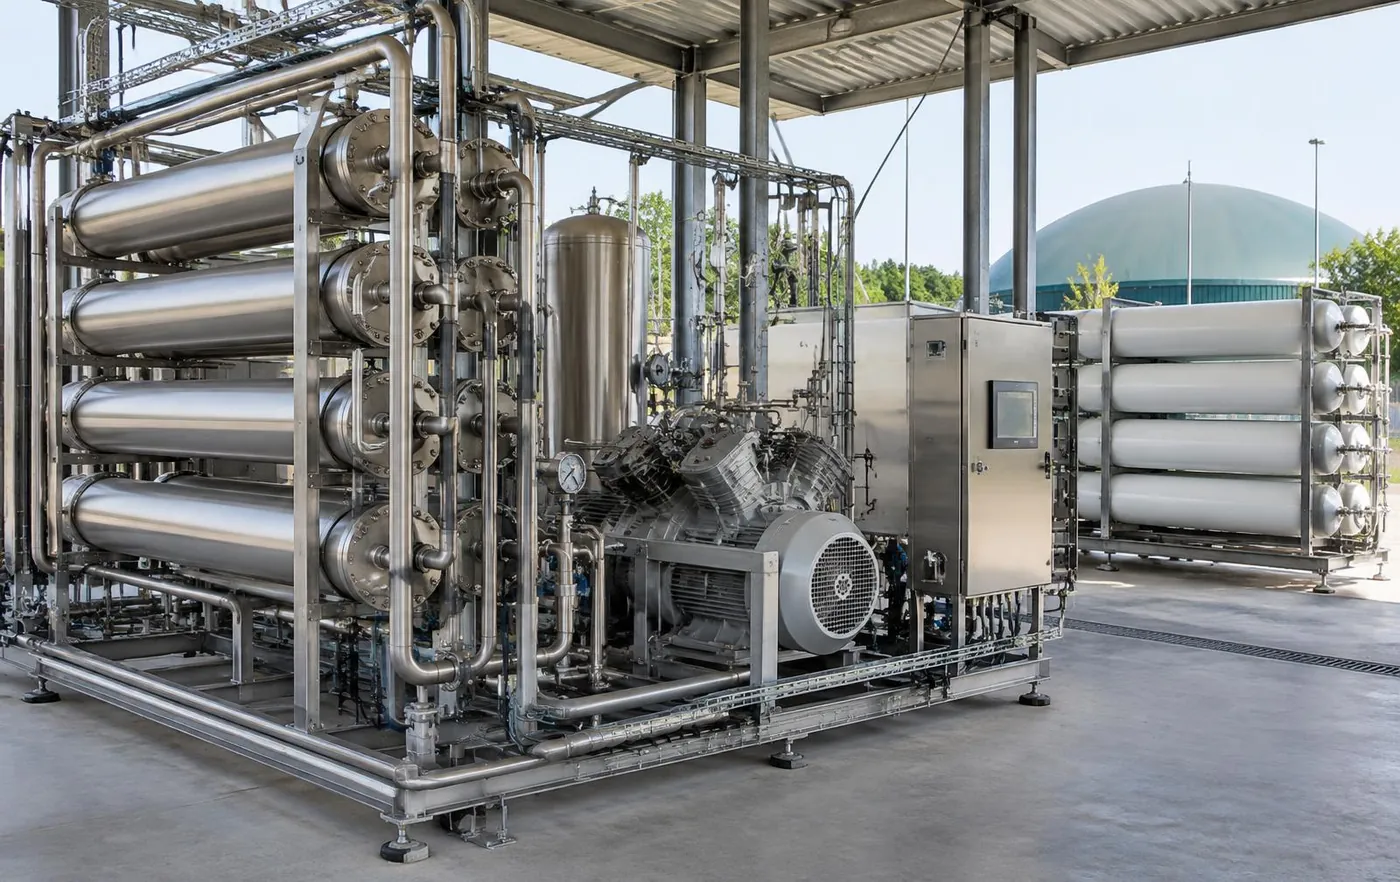
Upgrading and compressor packages integrated without changing OEM control logic.
Deployable at the edge, on-premise, in the cloud or hybrid—with segmented, encrypted connections, an ISA-95-style asset hierarchy and IEC 62443-aligned OT practices. The digital layer supervises and reports; it does not replace control loops or safety logic.
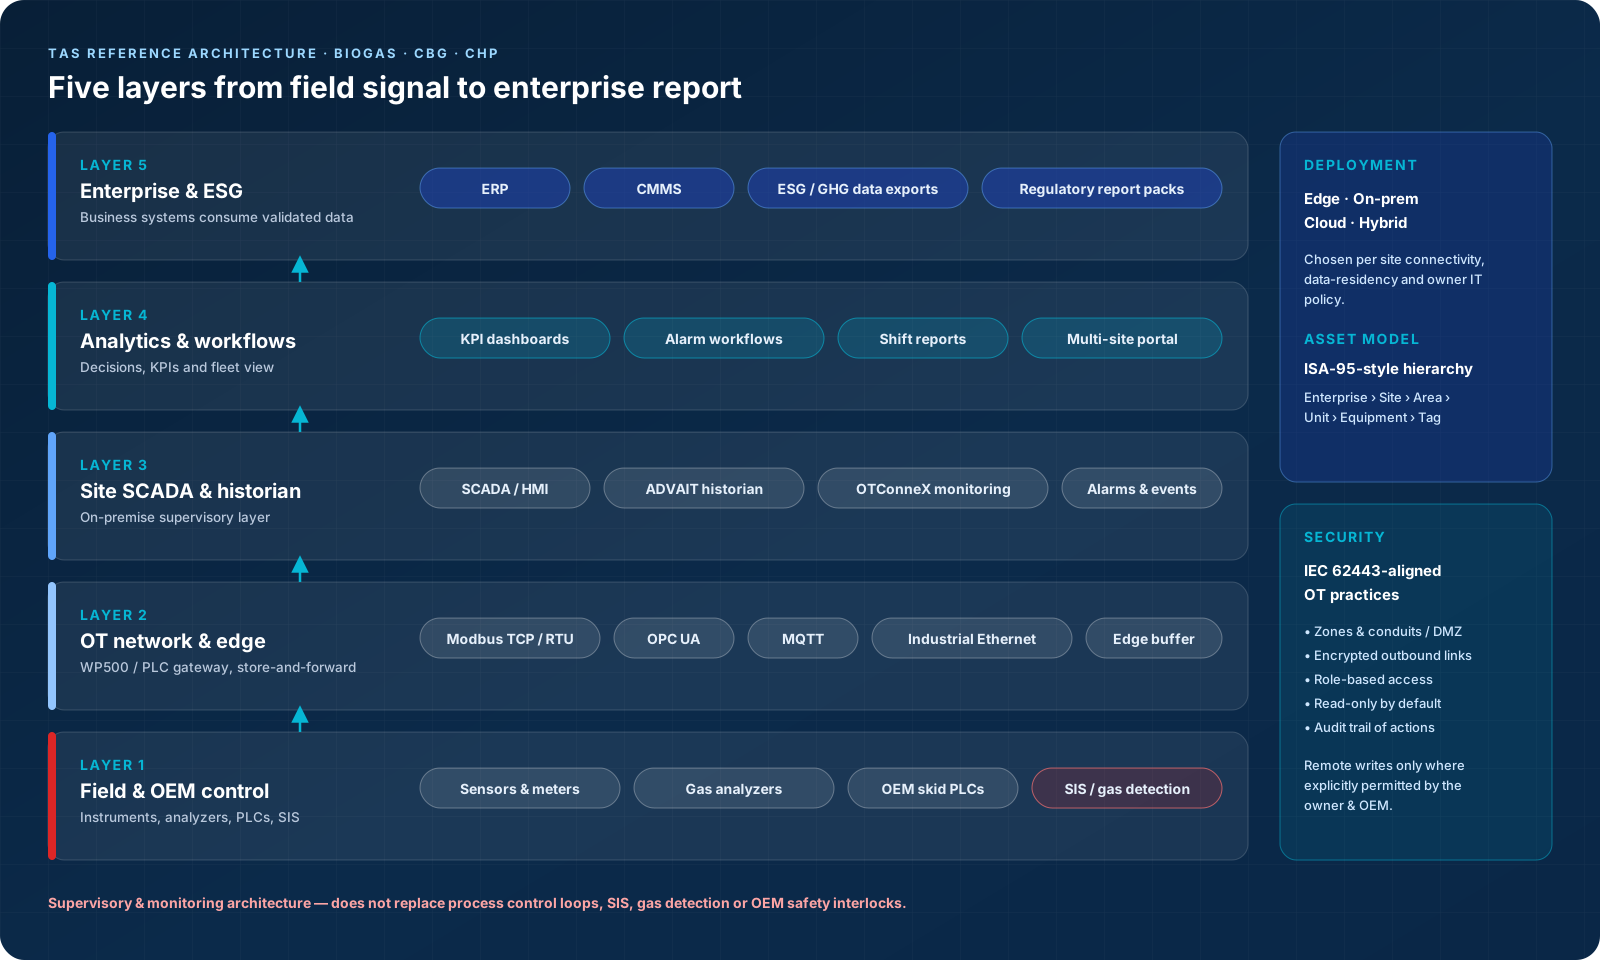
ERP, CMMS and ESG / regulatory data exports from validated records.
KPI dashboards, alarm workflows, shift reports and a fleet / multi-site portal.
On-prem SCADA/HMI, ADVAIT historian and OTConneX monitoring.
WP500 or PLC gateway—Modbus TCP/RTU, OPC UA, MQTT, industrial Ethernet, store-and-forward.
Sensors, meters, analyzers, OEM skid PLCs, SIS and gas detection.
Every KPI is only as good as its source. TAS documents the instrument, calculation and reference conditions behind each number, and flags data quality where inputs are missing.
t / day
Weighbridge and dosing records, by supplier and digester.
kg VS / m³·d
Calculated where feed flow and lab solids data are available.
°C · deviation
Online temperature with lab VFA/TAC context.
Nm³ / day
Normalised only with valid T/P inputs and configured reference.
% CH₄
From installed analyzers, with status and calibration flags.
ppm
Raw and treated gas, against equipment limits.
kg / day
Compression, cascade and dispensing totals reconciled.
kWh · heat
CHP generation, export and auxiliary consumption.
Nm³ / t
Methodology-dependent; basis (wet, VS, CH₄) stated on every report.
%
By section: digestion, upgrading, compression, CHP.
events · flare h
Logged events and flare hours from installed detection and meters.
kWh · h · Δ%
Parasitic load, run-hours and meter-to-meter balance.
Biogas is flammable and can contain toxic H₂S. TAS designs digital systems that respect independent protection layers and the project’s hazardous-area design.
Start with one plant or one process area, prove the data, then scale across sites.
Objectives, existing systems, connectivity and stakeholder roles.
Tag lists, OEM interfaces, analyzer outputs and meter inventory.
PLC/SCADA, edge gateway, historian and secure network design.
KPI definitions agreed and checked against field and lab data.
Factory and site acceptance testing with the owner, OEM and EPC.
Operator training, documentation, support and multi-site roll-out.
Talk to TAS about automation, instrumentation integration and digital operations for your anaerobic digestion, CBG / Bio-CNG, RNG or CHP project. We work with plant owners, process OEMs and EPCs from design through lifecycle support.
© 2026 TAS. All rights reserved.